
Contact Us
Tel: +44 (0)20 7799 1460
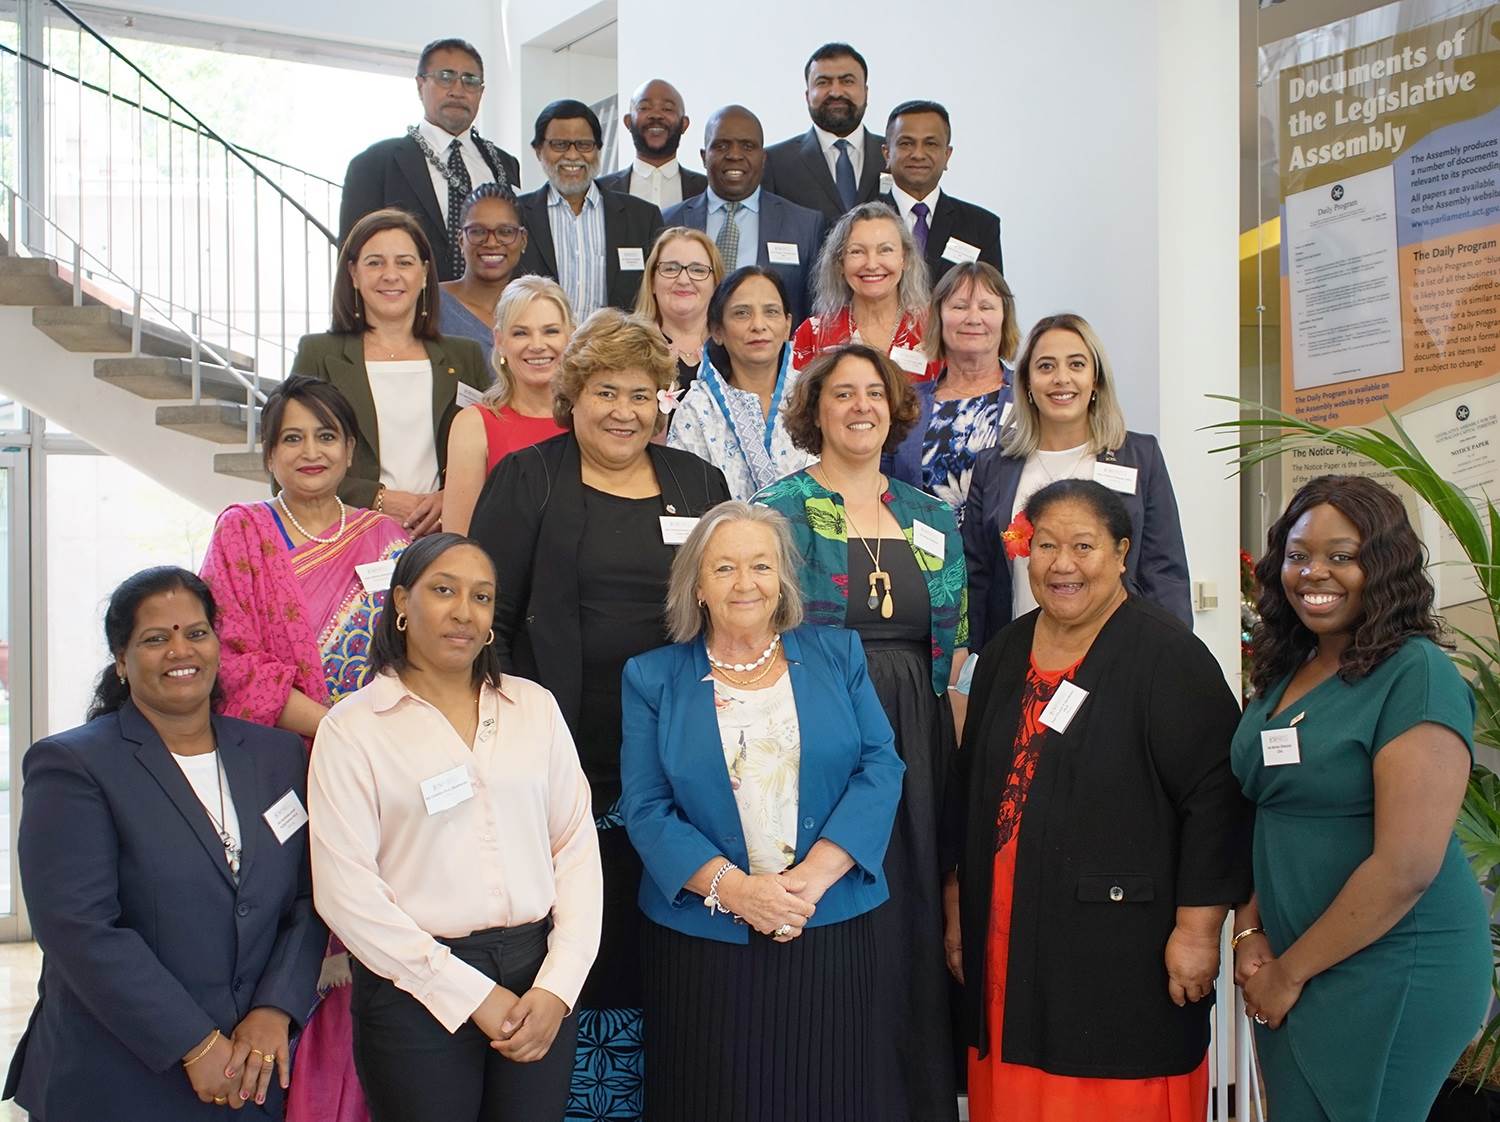
Since its establishment, the Commonwealth Women Parliamentarians (CWP) network has been recording data on the number of women Parliamentarians that there are across the Commonwealth. Although this data has been used for internal purposes, in 2024, for the first time, the CWP has made the data publicly available.
For the CWP network, collecting data of this kind is crucial for the following reasons:
Representation: Women make up roughly half of the global population, so their voices and perspectives should be adequately represented in decision-making bodies like Parliaments. Tracking the number of women in Parliament helps measure progress towards achieving gender parity and ensuring that women's voices are heard in policymaking.
Equality and Rights: Monitoring the presence of women in Parliament is a measure of progress toward gender equality and women's rights. It reflects a society's commitment to ensuring equal opportunities for men and women in political participation and leadership roles.
Policy Outcomes: Research suggests that diverse legislative bodies produce better policy outcomes. When women are adequately represented in Parliaments, it increases the likelihood of policies that address issues affecting women and promote gender equality. This can include legislation on issues like reproductive rights, childcare, equal pay and combating gender-based violence.
Role Models: Visible representation of women in Parliament can serve as role models for future generations of women leaders. Seeing women in positions of power can inspire girls and young women to pursue careers in politics and other male-dominated fields, thereby contributing to greater diversity and inclusion in leadership roles across society.
Accountability: Tracking the number of women in Parliament can hold governments and political parties accountable for their commitments to gender equality and women's representation. It provides a measurable benchmark against which progress can be assessed and deficiencies addressed.
Global Development Goals: Increasing the representation of women in decision-making positions is integral to achieving various global development goals, including those outlined in the United Nations' Sustainable Development Goals (SDGs). SDG 5 specifically targets achieving gender equality and empowering all women and girls, with increased female representation in political institutions being a key indicator of progress toward this goal.
In essence, collecting data on the number of women in Parliaments serves as a barometer for measuring societal progress toward gender equality and ensuring that women have a meaningful voice in shaping policies that affect their lives.
Total no. of Women Parliamentarians (as at September 2024):
Average total percentage overall across the Commonwealth:
| Rank | CPA Region | Lower House | Upper House | Total Percentage |
| 1 | Australia | 38.7 | 49.5 | 44.1% |
| 2 | Canada | 33.2 | 54.5 | 43.8% |
| 3 | CAA | 29.7 | 40.9 | 35.3% |
| 4 | BIM | 26.2 | 32.7 | 29.4% |
| 5 | Africa | 18.9 | 28.3 | 23.6% |
| 6 | Pacific | 18.1 | 18.1% | |
| 7 | Asia | 11.1 | 18.8 | 15% |
| 8 | SEA | 13.21 | 16.4 | 14.8% |
| 9 | India | 10.2 | 8.4 | 9.3% |
| Rank | Legislature | Lower House Election Year | Lower House Seats | Lower House No. Women | Lower House Percentage Women | Upper House Election Year | Upper House Seats | Upper House No. Women | Upper House Percentage Women | Total Average |
| 1 | Australian Capital Territory | 2020 | 25 | 13 | 52.00 | N/A | N/A | N/A | N/A | 52.00% |
| 2 | Tasmania | 2024 | 35 | 15 | 42.86 | 2024 | 15 | 9 | 60.00 | 51.43% |
| 3 | Victoria | 2022 | 88 | 41 | 46.59 | 2022 | 40 | 22 | 55.00 | 50.80% |
| 4 | Rwanda | 2024 | 80 | 51 | 63.75 | 2019 | 26 | 9 | 34.62 | 49.18% |
| 5 | Australia Federal | 2022 | 150 | 57 | 38.00 | 2022 | 76 | 43 | 56.58 | 47.29% |
| 6 | Québec | 2022 | 125 | 58 | 46.40 | N/A | N/A | N/A | N/A | 46.40% |
| 7 | Scotland | 2021 | 129 | 59 | 45.74 | N/A | N/A | N/A | N/A | 45.74% |
| 8 | New Zealand | 2023 | 123 | 56 | 45.53 | N/A | N/A | N/A | N/A | 45.53% |
| 9 | South Africa | 2024 | 390 | 176 | 45.13 | 2024 | 54 | 24 | 44.44 | 44.79% |
| 10 | Northern Cape | 2024 | 30 | 13 | 43.33 | N/A | N/A | N/A | N/A | 43.33% |
| Rank | Legislature | Lower House Election Year | Lower House Seats | Lower House No. Women | Lower House Percentage Women | Upper House Election Year | Upper House Seats | Upper House No. Women | Upper House Percentage Women | Total Average |
| 1 | Rwanda | 2024 | 80 | 51 | 63.75 | 2019 | 26 | 9 | 34.62 | 49.18% |
| 2 | Australia Federal | 2022 | 150 | 57 | 38.00 | 2022 | 76 | 43 | 56.58 | 47.29% |
| 3 | New Zealand | 2023 | 123 | 56 | 45.53 | N/A | N/A | N/A | N/A | 45.53% |
| 4 | South Africa | 2024 | 390 | 176 | 45.13 | 2024 | 54 | 24 | 44.44 | 44.79% |
| 5 | Mozambique | 2019 | 250 | 108 | 43.2 | N/A | N/A | N/A | N/A | 43.2% |
| 6 | Canada Federal | 2021 | 336 | 103 | 30.65 | N/A | 101 | 55 | 54.46 | 42.56% |
| 7 | Guyana | 2020 | 71 | 28 | 39.44 | N/A | N/A | N/A | N/A | 39.44% |
| 8 | Dominica | 2022 | 32 | 12 | 37.50 | N/A | N/A | N/A | N/A | 37.50% |
| 9 | Tanzania | 2020 | 393 | 147 | 37.40 | N/A | N/A | N/A | N/A | 37.40% |
| 10 | United Kingdom | 2024 | 650 | 263 | 40.46 | N/A | 785 | 228.00 | 29.04 | 34.75% |

| Region | Country | National/Subnational | Legislature | Lower House Election Year | Lower House Seats | Lower House No. Women | Lower House Percentage Women | Upper House Election Year | Upper House Seats | Upper House No. Women | Upper House Percentage Women | Total Average |
| Africa | Nigeria | Subnational | Abia | 2023 | 24 | 0 | 0.0 | N/A | N/A | N/A | N/A | 0.0 |
| Africa | Nigeria | Subnational | Bauchi | 2023 | 31 | 0 | 0.0 | N/A | N/A | N/A | N/A | 0.0 |
| Africa | Nigeria | Subnational | Borno | 2023 | 30 | 0 | 0.0 | N/A | N/A | N/A | N/A | 0.0 |
| Africa | Nigeria | Subnational | Gombe | 2023 | 24 | 0 | 0.0 | N/A | N/A | N/A | N/A | 0.0 |
| Africa | Nigeria | Subnational | Imo | 2023 | 27 | 0 | 0.0 | N/A | N/A | N/A | N/A | 0.0 |
| Africa | Nigeria | Subnational | Jigawa | 2023 | 30 | 0 | 0.0 | N/A | N/A | N/A | N/A | 0.0 |
| Africa | Nigeria | Subnational | Kano | 2023 | 40 | 0 | 0.0 | N/A | N/A | N/A | N/A | 0.0 |
| Africa | Nigeria | Subnational | Katsina | 2023 | 34 | 0 | 0.0 | N/A | N/A | N/A | N/A | 0.0 |
| Africa | Nigeria | Subnational | Kebbi | 2023 | 24 | 0 | 0.0 | N/A | N/A | N/A | N/A | 0.0 |
| Africa | Nigeria | Subnational | Niger | 2023 | 27 | 0 | 0.0 | N/A | N/A | N/A | N/A | 0.0 |
| Africa | Nigeria | Subnational | Osun | 2023 | 26 | 0 | 0.0 | N/A | N/A | N/A | N/A | 0.0 |
| Africa | Nigeria | Subnational | Rivers State | 2023 | 32 | 0 | 0.0 | N/A | N/A | N/A | N/A | 0.0 |
| Africa | Nigeria | Subnational | Sokoto | 2023 | 30 | 0 | 0.0 | N/A | N/A | N/A | N/A | 0.0 |
| Africa | Nigeria | Subnational | Yobe | 2023 | 24 | 0 | 0.0 | N/A | N/A | N/A | N/A | 0.0 |
| Africa | Nigeria | Subnational | Zamfara | 2023 | 24 | 0 | 0.0 | N/A | N/A | N/A | N/A | 0.0 |
| Pacific | Tuvalu | National | Tuvalu | 2024 | 16 | 0 | 0.00 | N/A | N/A | N/A | N/A | 0.00 |
The data included in this Workbook and on this site has been compiled by the CPA via numerous sources. Data is updated bi-annually and information is based on data as at 30 September 2024.
Please contact programmes@cpahq.org if any of the data provided is no longer up-to-date.
Please note: The CWP data is likely to change by the end of 2024 due to a higher-than-average number of elections due to take place in Commonwealth Parliaments this year. Further data in subsequent years will also provide a comparative analysis in the future. We also acknowledge the IPU data for national Parliaments which is included as part of this analysis.